
So, you’re neck-deep in spreadsheets, graphs, and dashboards.
Your screen looks like NASA’s mission control, and you’ve got numbers for everything — from click-through rates to the average time someone spent staring at your latest LinkedIn post (well, maybe not that in-depth).
Impressive?
Maybe.
Useful?
That’s a different story.
Here’s the rub.
In this golden age of data, it’s like we’re in an all-you-can-eat buffet of metrics.
And let’s face it, some of us are loading up on the digital marketing equivalent of bread rolls and ignoring the prime rib.
Sure, those page views and social likes look tasty, but are they really what you came for?
Are they driving your business forward?
Spoiler alert: Probably not.
In the rush to gobble up data, it’s easy to focus on the wrong metrics.
You might be high-fiving over 500 new followers on Twitter, but if your lead-to-customer conversion is stuck in the mud, what have you really accomplished?
Here’s where benchmarks come in.
Why not all metrics are equal
Let’s say you’re an artist.
Your latest masterpiece has gotten a thousand ‘oohs’ and ‘aahs,’ but not a single person bought it.
While the praise might be good for the ego, it doesn’t exactly pay the bills, does it?
In the same vein, some metrics might look great on your analytics dashboard but do zilch for your actual business goals.
These are often called “vanity metrics” — data points that make you feel good, but won’t be invited to your year-end performance review.
You know the ones: page views, social media followers, and so on.
If a metric isn’t doing anything to drive your business forward, it’s basically just a nice-looking number.
Maybe it’s time we cut to the chase.
The rule of thumb here is straightforward — if it doesn’t support your business objectives, it’s meaningless.
Marketing isn’t about collecting data like they’re trading cards; it’s about selecting the right data that propels your business.
Think of metrics as tools.
Some are like fancy electric screwdrivers, but if your main goal is to hammer in a nail, well, you know what you need to do.
7+ benchmarks you need to know
Alright, enough with the philosophical musings on metrics and vanity numbers.
Let’s roll up our sleeves and dig into the benchmarks that matter — the ones that should be in your line of sight when you’re plotting your next big move.
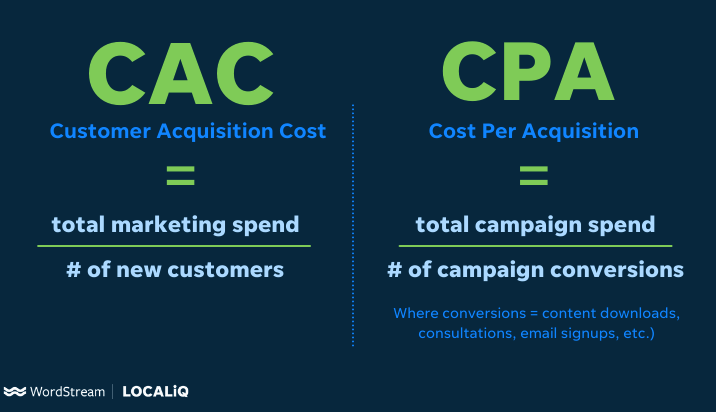
Customer Acquisition Cost (CAC)
Customer Acquisition Cost, or CAC for those who enjoy alphabet soup, is more than just another acronym to add to your marketing lingo.
It’s a number that will either make you the office hero or the scapegoat at the next quarterly review.
Think about it.
You might be raking in leads like a pro, but what’s the cost of turning those leads into paying customers?
It’s one thing to have a flood of people sign up for your free eBook, and quite another to actually get them to sign a contract or make a purchase.
Let’s say you spent $10,000 on a dazzling Google Ads campaign and netted 100 customers.
Feels like a win, right?
Not so fast.
Your CAC for that campaign is $100 per customer.
Now, if your product subscription fee is just $20 a month, you’d need those customers to stick around for at least 5 months just to break even.
Are you prepared for that level of commitment?
CAC tells you if you’re paying too much for the pleasure of gaining customers.
So next time you’re about to hit ‘launch’ on that ad campaign, take a long, hard look at your expected CAC.
It’s not just about counting your chickens, but figuring out how much you’re spending to feed them.
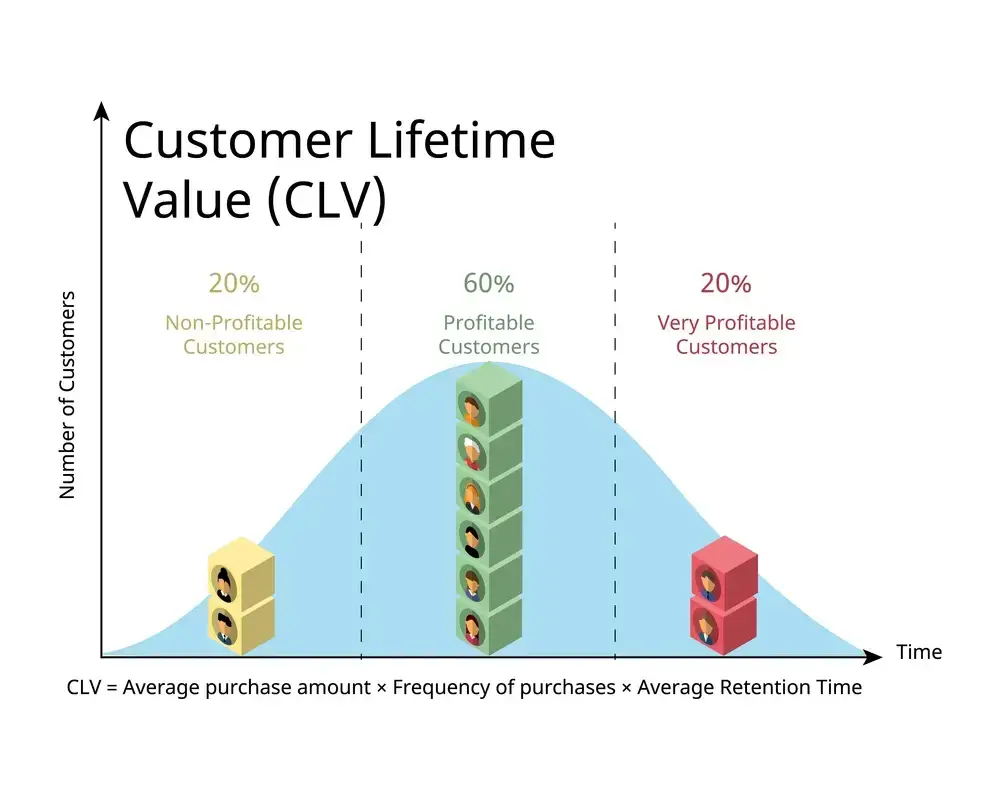
Customer Lifetime Value (CLV / CLTV)
If CAC is your business’s first date, consider Customer Lifetime Value (CLV) the long-term relationship.
It’s the sum of all the value a customer will bring to your business over their entire lifecycle.
Why does this matter?
Well, particularly in the B2B space where sales cycles are more like marathons than sprints, understanding CLV can make you feel a whole lot better about yourself.
Let’s say you’re selling enterprise software with a subscription fee of $500 per month.
It’s not uncommon for B2B relationships to last several years if you’re delivering value.
Say, on average, a client sticks around for about 3 years — that’s 36 months.
Do the math, and each customer could potentially bring in $18,000 over their lifetime ($500 x 36).
But hold your horses, don’t forget costs like customer service and software maintenance.
Let’s assume those add up to $100 per month, subtract that from your monthly revenue, and you get $400.
Over the course of 36 months, the net CLV would be $14,400 ($400 x 36).
In this scenario, if your CAC was, say, $1,000, it’s obvious that the long-term value of the customer is overwhelmingly positive.
Your CLV:CAC ratio would be 14.4:1, meaning for every dollar spent on acquisition, you’re earning back $14.40 over the customer’s lifetime.
Every Tom, Dick and Harry on the internet says that a healthy CLV:CAC ratio is 3:1 or higher.
Sales Conversion Rate (CVR)
Here’s a scenario: you’ve got a fishing net, and you’re out at sea.
You cast your net wide, dragging it through the water, excited about your big catch.
You pull it in, and—well, turns out you’ve caught a lot of seaweed and a couple of soda cans.
Maybe one or two fish if you’re lucky.
The net was full, sure, but what was it full of?
Sh*t.
In the marketing world, your net is your lead generation efforts, and the fish you’re after are actual sales.
Sales Conversion Rate (CVR) measures how many of those leads actually convert into paying customers.
It’s the fine line between a sales funnel that’s just a decorative ornament and one that’s a well-oiled machine.
Suppose you had 1,000 people visit your product landing page last month, and 20 of them made a purchase.
Your sales CVR would be 2% (20/1,000 x 100).
Seems small, right?
But in a B2B context, where each sale could potentially be worth thousands of dollars, even a slight change in CVR can make a massive impact on your revenue.
Why keep an eye on this number?
Well, if your CVR is low despite high traffic, it’s a red flag.
It signals issues like ineffective sales pitches, poor lead quality, or a disconnect between your marketing and sales efforts.
On the other hand, a high CVR could signify that you’re hitting the sweet spot between attracting quality leads and effectively converting them.
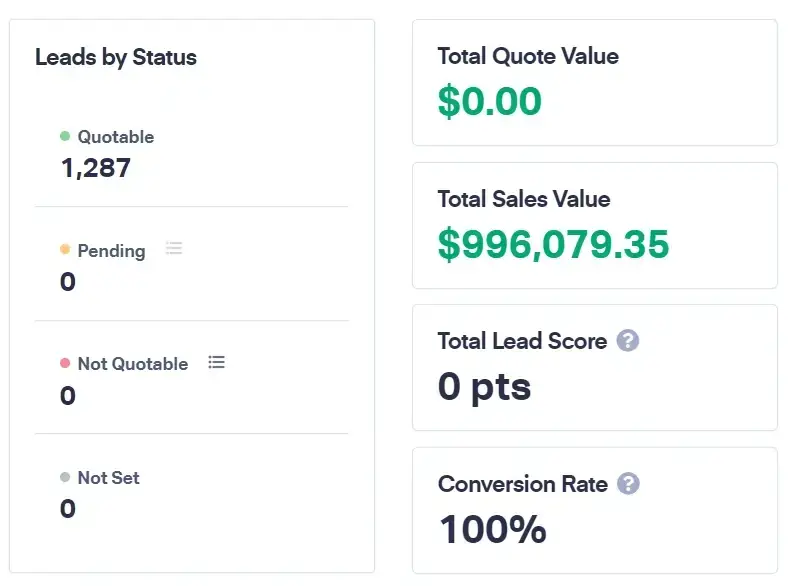
Conversion Value / Sales Value
Let’s talk money — specifically, the money that each converted lead brings into your business.
Not all leads are created equal, and not all conversions contribute the same value to your bottom line.
While your Sales Conversion Rate (CVR) gives you a snapshot of how effective your sales funnel is, your Conversion Value or Sales Value shows you the quality of those conversions.
Think of it like a harvest.
You might have two apple trees, both yielding a hundred apples each.
One tree, however, produces small, tart apples, and the other one offers large, juicy, premium-grade apples.
Naturally, you’re going to make more money selling the premium apples, right?
In business terms, you should look at your CAC in conjunction with the value of each sale.
For instance, if you have a high CAC of $2,000 but each conversion yields a sales value of $10,000, you’re still ahead of the game.
On the flip side, a low CAC of $200 isn’t so impressive if each sale only nets you $250.
Let’s take a practical example.
You’re selling two types of business software:
- a basic package with a sales value of $500
- and a premium package priced at $2,500.
If your CAC for the basic package is $100 and for the premium package is $400, then the premium package is bringing in a higher conversion value despite the higher CAC.
Essentially, you’re investing $400 to get a return of $2,100 as opposed to spending $100 to earn $400.
The bottom line?
A low CAC isn’t automatically a win, nor is a high CAC a disaster.
It’s all relative to the value that each conversion brings.
So next time you examine your metrics, remember to weigh your cost against your value.
It’s the difference between picking apples and picking the right apples.
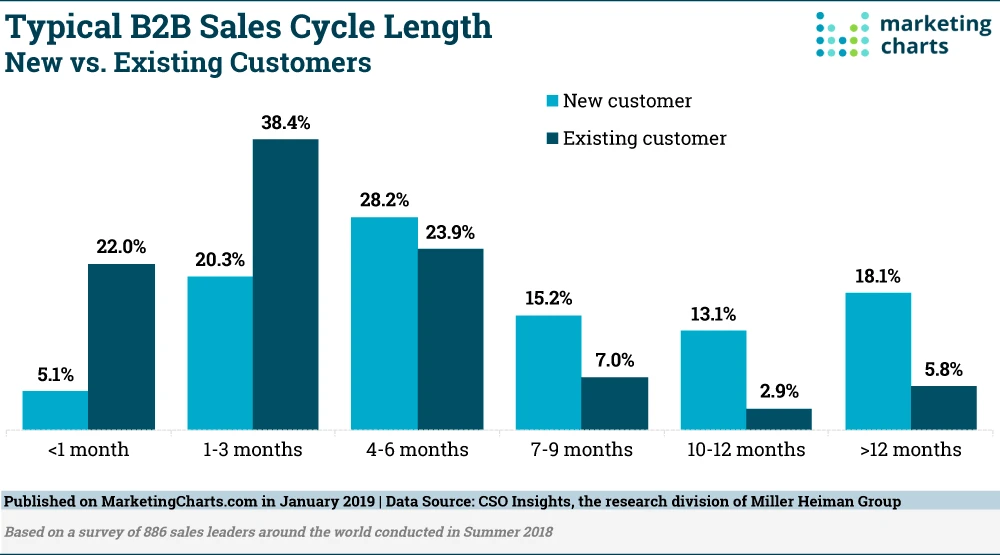
Sales cycle length
This metric tells you how long it takes, on average, to turn a prospective lead into a paying customer.
It’s the timeline from that first cold email or discovery call to the joyous moment the contract is inked and the deal is sealed (and… money in the bank).
Why does this matter?
Well, time is money.
A long sales cycle isn’t just a test of patience; it’s also a drain on resources.
The longer it takes to close a deal, the more time and effort your team has to invest in nurturing leads, following up, and jumping through those corporate hoops.
This can impact your cash flow and even create bottlenecks in your sales pipeline, as your team may be too tied up with old leads to effectively chase new ones.
Suppose you’re in the business of selling industrial machinery.
Your sales team takes, on average, six months to close a deal.
During these months, they’re making calls, sending emails, and even travelling for in-person meetings.
All these activities cost money and human hours.
Now, if your product costs $50,000, and you have a high conversion rate, perhaps the long cycle is justified.
But if you’re only selling a $5,000 product with the same six-month lead time and resource commitment, it might be time to rethink your sales strategy.
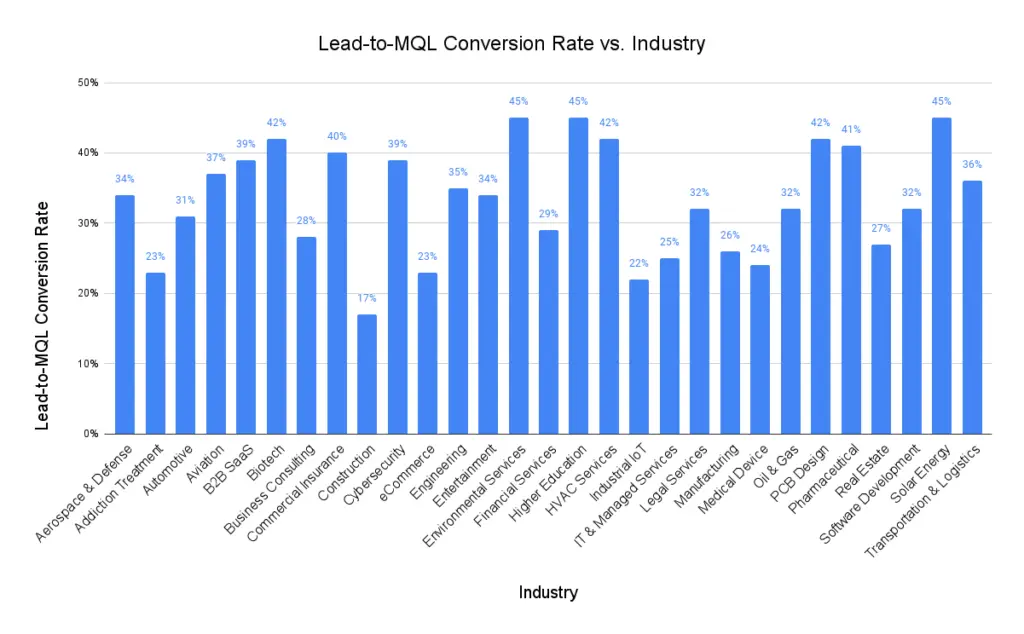
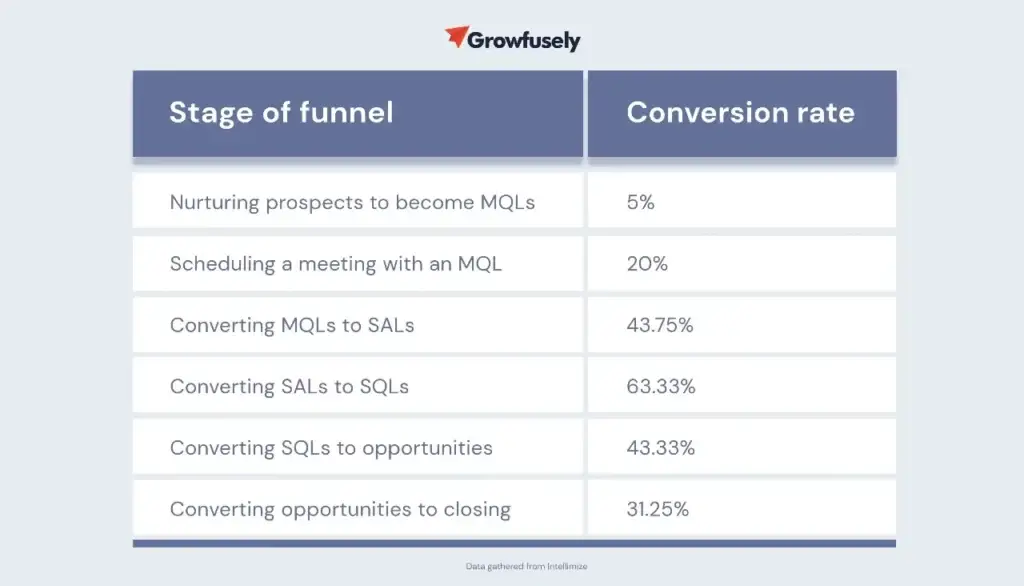
Lead-to-MQL ratio
When it comes to leads, quality often trumps quantity.
You could be drawing in hundreds of leads a month, but if they’re about as qualified as my dog trying to do long division, you’re just wasting time and resources.
Enter the Lead-to-MQL Ratio, a metric designed to sift the wheat from the chaff.
MQL, or Marketing Qualified Lead, is a lead that has been deemed more likely to become a customer compared to other leads.
This qualification is based on what they’ve done (like downloading a whitepaper or signing up for a webinar), and what you know about them (company size, role, etc.).
The Lead-to-MQL Ratio tells you what percentage of your leads are reaching this qualified status.
Why should you care?
With B2B marketing benchmarks, knowing that your leads are warmed up and ready for the next step in the sales cycle can be a huge relief.
It means that your marketing efforts are not just generating interest, but they’re drawing in the right crowd.
Let’s say you generate 1,000 leads in a month, and 100 of them become MQLs.
Your Lead-to-MQL ratio is 10%.
If next month you ramp up your marketing spend and generate 1,500 leads but still only net 100 MQLs, your ratio drops to approximately 6.7%.
It’s a warning sign that, despite the uptick in leads, you’re not necessarily moving in the right direction in terms of quality.
So, instead of focusing solely on how many leads you’re raking in, pay attention to how many of them are actually worth the chase.
It’s a smarter, more sustainable approach to B2B marketing.
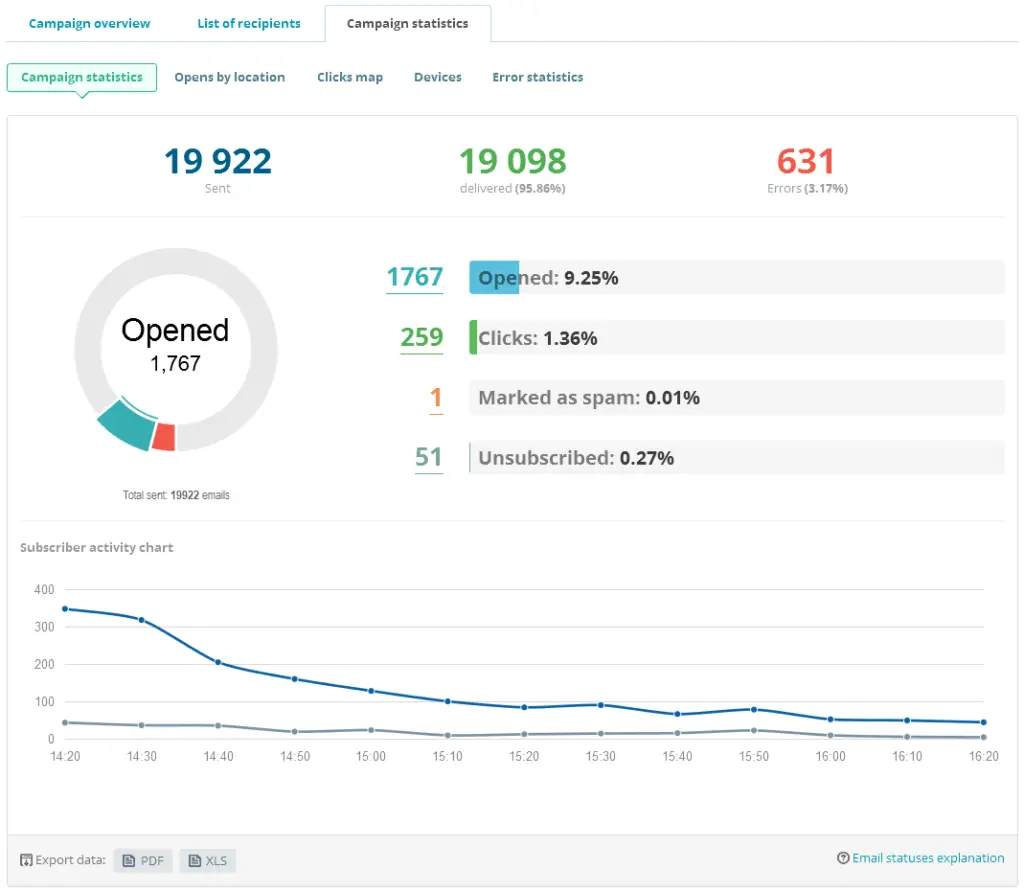
Email open rate
These days, our inboxes are as crowded as a subway car during rush hour.
So when someone not only receives your marketing email but actually opens it, that’s no small feat.
This is where your Email Open Rate comes in, and it’s more than just a vanity metric when used correctly.
The Email Open Rate measures the percentage of people who open the email you send out.
In B2B marketing, this is a good pulse check.
Why?
Because email is often the primary channel for nurturing leads, disseminating valuable content, and building relationships with prospective clients.
In a world where attention is currency, getting someone to open your email is winning a small battle.
Let’s say you send an email to 1,000 potential clients and 200 open it.
Your Email Open Rate would be 20%.
While that number might not cause fireworks, industry benchmarks for B2B Email Open Rates often hover around 15-19%.
So, you’re on the right track.
But what if your rate is lower?
It’s a signal to revisit your subject lines, your sender name, or even the time you’re sending out emails.
Because even before they read your pitch or download that whitepaper, they have to open the email first.
Content engagement rate
Simply publishing articles, whitepapers, or videos isn’t enough.
Your audience needs to interact with it for it to serve its purpose in your B2B marketing strategy.
That’s where the Content Engagement Rate comes in.
This benchmark goes beyond the usual “pageviews” and “downloads” to see how people are actually interacting with your content.
Are they spending time reading through your articles, or bouncing faster than a ping-pong ball?
Are they sharing your content, leaving comments, or clicking through to other pages?
Now, you’re probably wondering, “Sounds fancy, but how do I track this?”
It’s not as hard as you might think.
Most content management systems (CMS) and social media platforms come with built-in analytics.
For even more granular data, consider setting up event tracking to see how users engage with specific elements like buttons or downloads.
Here’s a simple way to calculate it: [(Total Engagements / Total Views) x 100].
Say, for example, you publish an article that gets 1,000 views.
If it receives 200 social shares, 50 comments, and 100 click-throughs to a call-to-action, that’s 350 total engagements.
Your Content Engagement Rate would be [(350 / 1,000) x 100] = 35%.
Why is this important?
A high Content Engagement Rate is often a strong indicator that your material is resonating with your audience.
It means not only are they consuming your content, but they’re finding it valuable enough to interact with.
In B2B, where sales cycles are longer and relationships are key, fostering this kind of engagement can be a golden ticket to deeper connections and future conversions.
The zero BS B2B marketing benchmarks
So there you have it — a curated, no-nonsense tour through the B2B marketing benchmarks that genuinely matter.
If you want to see how these translate into results, take a look at our B2B manufacturing marketing agency case study.
I know, I know, data can sometimes feel like an overgrown jungle: lush, vast, and a little intimidating.
But the beauty of benchmarks is that they act as your machete, helping you cut through the noise and focus on the metrics that will actually move the needle.
Remember, what you can measure, you can manage.
And what you can manage, well, you can absolutely rock.
But don’t take these benchmarks as gospel; they’re more like guidelines.
Your business is unique, and your benchmarks should align with what’s actually going to help you reach your goals.
So adapt, iterate, and keep your eyes on the metrics that mirror your objectives.
Because at the end of the day, numbers are just stories with data — make sure yours is worth telling.
Cheers to smarter, more effective B2B marketing.
Here’s to making each click, each open, and each engagement count.
No vanity, all substance.